Rhayna Lillie presents to LANDFIRE leadership
 CDL
CDL
A key, if not less-than-exciting step in conservation planning is conducting a ‘situation analysis’. In this step you build understanding of the area where you are doing your work. One component is often mapping and comparing ecosystems past and present. Rhayna Lillie was asked to do this to support land management in the Uncompahgre region of southwestern Colorado. Sound simple enough, but doing this can be extremely time consuming, and difficult. Why? first there’s the “apples and oranges” issue where ecologists might have multiple names for the same ecosystem. Second, technical difficulties such as your software locking up, or code producing strange outputs. Third, there is no cookbook or recipe for this. Rhayna Lillie fearlessly jumped into this morass and not only made beautiful maps and charts, but also excellently delivered a well-prepared presentation to leaders of the LANDFIRE program.
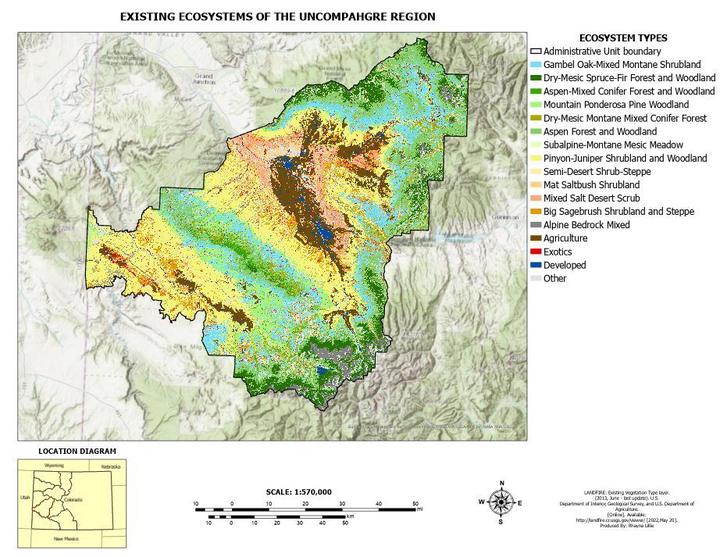
<<<<<<< HEADTo conduct this initial assessment, Rhayna first downloaded data sets, some of which have ’novel’ names such as Biophysical Settings (maps dominant vegetation systems that were on the landscape prior to European colonization). Second she worked in ArcGIS to process the data, making sure that it was clipped and projected properly. Then came one of many challenges: mapping the data. The details that go into a beautiful (and useful map) are (if well done) never noticed by the viewer. Rhayna spent many hours working with colors, the legend and formatting to make her maps sparkle. In addition to mapping the spatial data, she did other processing that allowed her to compare historical to current vegetation. She exported the data from the GIS software, then imported it into R where she wrangled the data, made charts AND created her slideshow for presentation. How many people can use R to build a presentation?
=======To conduct this initial assessment, Rhayna first downloaded data sets, some of which have ‘novel’ names such as Biophysical Settings (maps dominant vegetation systems that were on the landscape prior to European colonization). Second she worked in ArcGIS to process the data, making sure that it was clipped and projected properly. Then came one of many challenges: mapping the data. The details that go into a beautiful (and useful map) are (if well done) never noticed by the viewer. Rhayna spent many hours working with colors, the legend and formatting to make her maps sparkle. In addition to mapping the spatial data, she did other processing that allowed her to compare historical to current vegetation. She exported the data from the GIS software, then imported it into R where she wrangled the data, made charts AND created her slideshow for presentation. How many people can use R to build a presentation?
>>>>>>> 5031cd0ac283ebf50027cce90c08b19b8743170fIn late August, 2022 Rhayna presented her work to Jim Smith and Henry Bastion of the LANDFIRE Business Lead Group. This group controls the direction and budgets for the LANDFIRE program! More personally for me Jim is my supervisor, and Henry the funder of our team among other things. Rhayna nailed her presentation. She was very well prepared, had a great script and addressed questions super professionally. We are now working to schedule a time for her to present to Bureau of Land Management staff who manage the Uncompahgre. There she hopes to contribute to their work, and learn more about specific challenges they face.
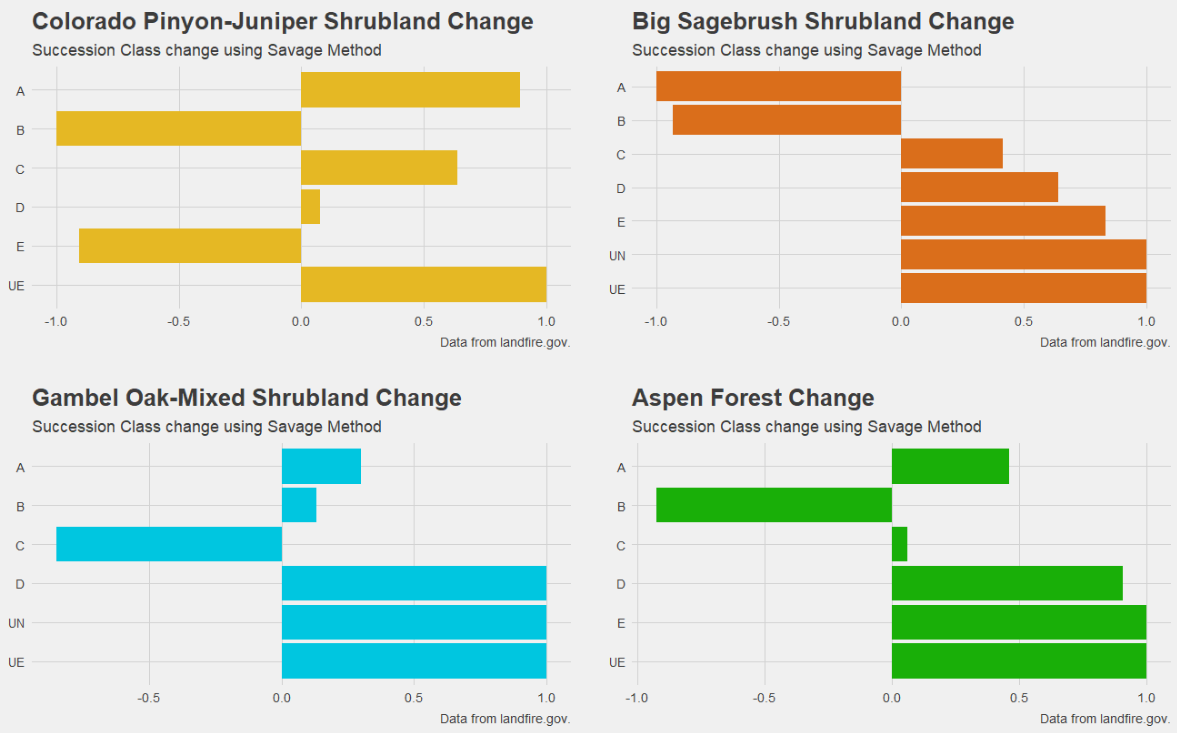
Bar charts created by Rhayna Lillie in R depicting under and over representation of succession classes for selected ecosystems.